Misinformation Amplification Analysis and Tracking Dashboard
By Integrity Institute chief research officer and co-founder Jeff Allen
Tracking how social media platforms respond to misinformation is crucial to understanding the risks and dangers that platforms can pose to democratic elections. At the Integrity Institute, we are tracking how misinformation performs on platforms to measure the extent to which platforms are amplifying misinformation, and the extent to which they are creating an incentive structure that rewards lies and misinformation online.How platforms respond to misinformation can change. Amplification of misinformation can rise around critical events if misinformation narratives take hold. It can also fall, if platforms implement design changes around the event that reduce the spread of misinformation. We will be tracking how misinformation is amplified on the platforms, updated weekly, heading into and after the US midterm elections, to see if the large platforms are taking responsible actions in response to misinformation.This work is part of our Elections Integrity Program. You can learn more about that here. You can also view all the quantitative results of this work in our Misinformation Amplification Tracking Dashboard.Background
Content that contains misinformation tends to get more engagement – meaning likes, views, comments, and shares – than factually accurate content. Mark Zuckerberg himself made this clear in his chart on the “Natural Engagement Pattern”.
This chart shows that as content gets closer and closer to becoming harmful, on average, it gets more engagement. Zuckerberg said that this pattern was true for a broad range of harms, which could include hate speech, self harm content, and also misinformation. According to Mark Zuckerberg, “no matter where we draw the lines for what is allowed, as a piece of content gets close to that line, people will engage with it more on average”. This has two implications for platform design and how we expect platforms to respond when users and organizations post misinformation on them. First, when platforms use machine learning models to predict user engagement on content, we should expect the predicted engagement to follow the actual engagement. When those predictions are used to rank and recommend content, specifically when a higher predicted engagement score means the content is more likely to be recommended or placed at the top of feeds, then we expect that misinformation will be preferentially distributed and amplified on the platform.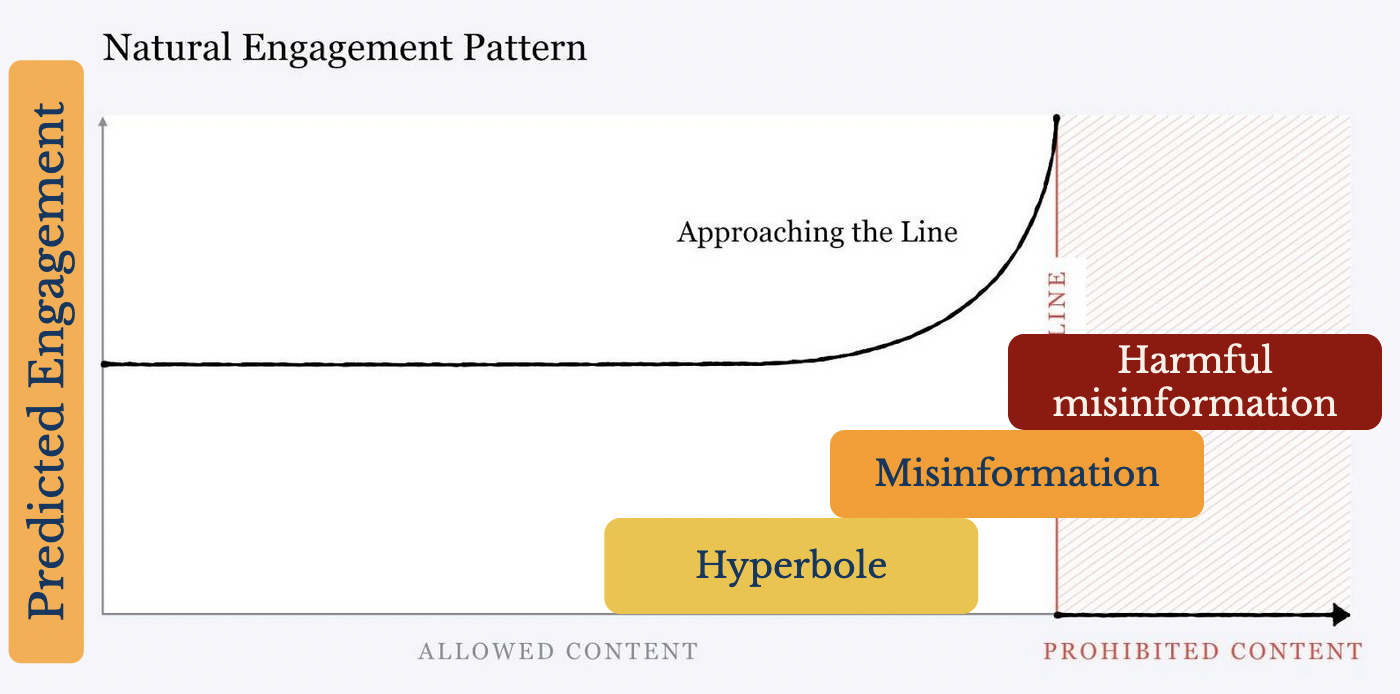
Second, when platforms give the ability to reshare content, we should expect the reshared content to contain a larger proportion of misinformation. Platform mechanisms that make it easy and frictionless to reshare content will tend to give broader distribution to misinformation, for the same “Natural Engagement Pattern” reason. Misinformation is much more likely to be reshared than factual content, especially when the friction to resharing is low.
In this analysis, we measure the extent to which large platforms amplify misinformation, through either their algorithms or platform design.Methodology
Given that we expect misinformation to get more engagement, we can ask the question: how much additional distribution should we expect a well crafted lie to get on the platforms?To measure the extent to which platforms amplify misinformation, we are tracking the average Misinformation Amplification Factor (MAF) for large platforms. The MAF is the ratio between how much engagement a misinformation post gets and what engagement we would expect it to get based on the historical performance of content from the creator. The MAF for a specific piece of misinformation content is MAF = Engagement on misinformation post / Average engagement on posts from creator prior to misinformation postWe source misinformation content from fact checkers that are in the International Fact Checking Network. From the fact checks that they produce, we extract links to social media posts within them and label if the fact check found that they were misinformation or accurate. We pull in engagement data on the fact checked posts, which, based on the platform, can include views, likes/faves/reactions, comments/replies, and shares/retweets.To estimate the expected engagement for misinformation posts, we compute the average engagement on all content from the creator who uploaded the misinformation content for the two weeks prior to them posting misinformation, or the 15 posts they made prior to the misinformation post when there is limited content in the two week window (In the rare case we can’t get 15 pieces of content for the baseline, we filter the post out of our analysis). This may include misinformation posts, if the creator is a serial poster of misinformation, which is one bias that can cause us to underestimate the MAF.Examples of how this works can be seen in the charts below. Each of the charts is for a single post (on TikTok and Instagram). For each of these posts, the baseline for the source that posted the misinformation was about ten times lower than the engagement the misinformation post got, so the MAF for the posts was around 10.

This gives us a MAF for every misinformation post that fact checkers identify. To compute the MAF for each platform, we average the MAF for every post we collect on it. (Specifically, we average the logarithm of the MAF, since engagement on content generally follows a log-normal distribution).We are doing this process on a daily basis. Every day, we collect social media posts from fact checks and pull in their engagement metrics and historical engagement on the creators. We get a new estimate of the Misinformation Amplification Factor for each platform. Most days there is not enough fact checked content to get a statistically meaningful measurement of the MAF, so a truly daily estimate is difficult. However, we can track a weekly estimate for most large platforms. We will be doing this process throughout the US midterm election to see if there are any dramatic swings in platform response to misinformation, and track the extent to which the platforms are amplifying misinformation during this critical period. By tracking the MAF, we will be able to tell if the online misinformation is trending in a negative direction with regards to the election, and if the platforms are taking responsible steps to curb its spread.Caveats and Limitations
It should be noted that we are not able to get a comprehensive and unbiased list of all misinformation on platforms. We are limited to posts that fact checkers investigate, which is not an unbiased, random sample of misinformation. For a fact checker to investigate a piece of content, it must come to the fact checker's attention, which will be more likely if the content gets broader distribution.This isn’t always the case, however, and there are plenty of examples of content with very low engagement numbers being fact checked. Fact checkers will sometimes search to find as many examples of a particular false claim as they can, and when they do find multiple instances of a particular misinformation claim, they will sometimes indicate which is the “primary” post which rose to their attention. We keep track when there is a “primary” post that fact checkers identify, and check to make sure our findings are consistent when limited to non-primary instances of misinformation. If we had access to internal data that platform employees have, it would be possible to create a much less biased data set to estimate the MAF. But we believe our data set is the best we can do from outside of the platforms and without any internal data.Still, the MAF should not be interpreted as how much amplification a platform gives every single piece of misinformation, but rather how much additional distribution you can reasonably expect to get with a well crafted lie. And it highlights how all of the large platforms are currently creating a clear incentive structure to lie.Current Findings
We are currently able to estimate a Misinformation Amplification Factor (MAF) for Facebook, Instagram, TikTok, Twitter, and YouTube.

The average MAF for each platform, with 90% confidence intervals, isFacebook: 4.2 (3.5 - 5.0)Engagement definition is Reactions + Comments + Shares
Instagram: 2.9 (2.4 - 3.5)Engagement definition is Likes + Comments
TikTok: 29 (9.5 - 91)Engagement definition is Views
Twitter: 35 (25 - 51)Engagement definition is Favs + Replies + Retweets
YouTube: 6.1 (3.3 - 12)Engagement definition is Views
We have a different number of fact checked posts for each platform. Facebook and Twitter have, by far, the largest number of fact checks on their content. This means that the MAF estimate for Instagram, TikTok, and YouTube will always have significantly higher uncertainties.
For Facebook and Twitter, we can look at how the MAF varies week to week, as well as the MAF distribution for all misinformation posts.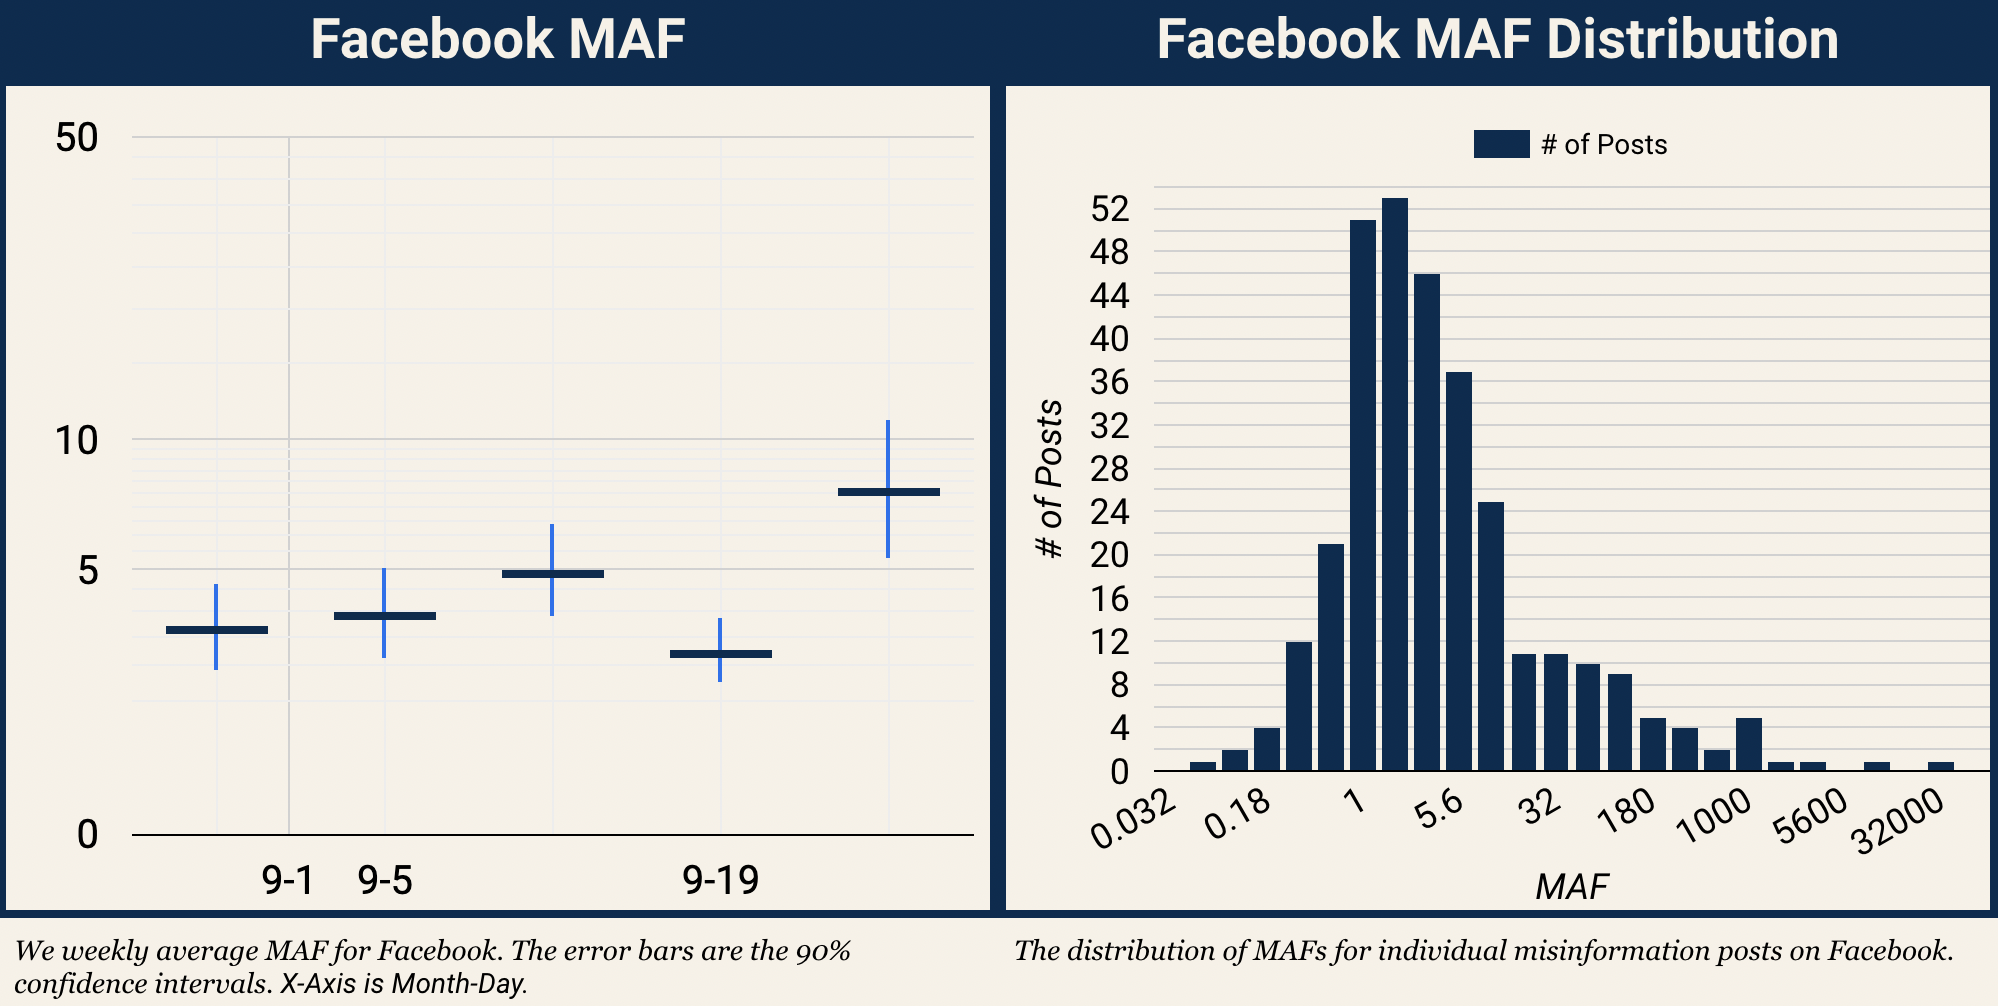

We can also look at the time difference between when the misinformation content is posted and when the fact checks on them are published. We see that there is typically a substantial delay between the misinformation and fact check, which is only natural, since tracking down the truth takes time and effort. But this does mean that by the time the fact checks are published, the misinformation content has likely already gotten most of the engagement it ever would have.
Studies suggest that the misinformation on social media typically gets 90% of its total engagement in less than one day, which means that for the majority of fact checked content, the fact check will come in after the post has already received the majority of its engagement. Facebook has a comprehensive program around “downranking” and limiting distribution of fact checked content, and yet still has a MAF of around four. This has a couple of implications.First, fact checkers need a full suite of tools and support from the platforms to help increase their efficiency if they are to be able to keep up with the speed of misinformation on the platforms. And second, fact checking existing content is not enough to stop the misinformation problem we see on platforms. Responsible design of platforms, in ways that work against misinformation and work for factual information, are another essential component.Fact checking programs are not ineffective. They help prevent misinformation from repeatedly going viral, get truth into the information ecosystem, and provide essential insights into the platforms. But they also cannot be the only tool we use to combat online misinformation. We need better platform design as well.Implications for Platform Design
All social media platforms have a Misinformation Amplification Factor above 1, which means that on average misinformation gets more distribution on the platforms than more benign content. Again, this matches our basic expectation. However, we do see a wide range of MAF for different platforms.Twitter and TikTok have the highest MAF. This is a reflection of strong mechanisms for “virality” on the platforms. On Twitter, the retweet feature has much less friction than other platforms’ sharing options. A tap and a confirmation is all that is required to retweet. For contrast, sharing a post on Facebook requires that a user pick which method they want to use to share it, either a direct message or new post, which leads to a new post prompt where there is an expectation to add commentary. The low friction sharing option on Twitter allows misinformation to spread far beyond the followers of the account that uploaded it.On TikTok, the vast majority of content is public, and most views are the result of recommendations of all public content on the platform. The recommendation system depends on machine learning models that are predicting engagement. This again means that misinformation can spread far beyond the followers of the account that created it, and that misinformation will perform well in the recommendation scores.Instagram has the lowest MAF by quite a bit. This is likely a reflection of design choices that Instagram has made for the platform. There are few mechanisms for “virality” on the platform. Sharing and retweet-like features are limited to Stories, which means that most content in people's feeds is limited to accounts they follow. There are some surfaces and means for Instagram to show users “recommended” content from accounts they don’t follow, most notably Reels now, but those are limited, and thus misinformation going viral on the platform has a more limited effect on distribution.The MAF for Facebook lands closer to Instagram. While it does have sharing features, it simply isn’t used to the same extent that the retweet feature on Twitter is. This is likely due to both the higher friction for sharing on Facebook, as discussed above, as well as the cultural norms that have developed on Twitter, where retweeting is a much more common practice among the users.However, we do see signs that Facebook’s MAF may increase as the platform adds more TikTok like features and increases the role of recommended content. The pieces of misinformation on Facebook that have the highest individual MAFs, with MAFs ranging from 290 to 35,000, were all Reels. If we specifically look at video content on Facebook, we see a MAF of 14, which is significantly higher than Facebook overall. This is because Reels and Facebook Watch, which are key for video distribution on Facebook, both rely heavily on algorithmic content recommendations, which are engagement focused.
So, as Facebook transitions more to Reels that are all recommended, we should expect the MAF of Facebook to increase and misinformation to perform better.Testing Signals to Separate Misinfo from Accurate Information
In addition to labeling which posts are identified as misinformation by the fact checkers, we also label what sources the fact checkers turned to for accurate information. This means we have a structured data set tracking social media accounts that post misinformation and what online sources are posting accurate information.We can use this to test various signals that can separate out sources of misinformation from sources of accurate information. An example signal that performs very well here is PageRank. We can use our social media aware PageRank data set, which computes PageRank scores for both social media accounts as well as domains in a unified calculation, as an example.

Sources that post misinformation very rarely have a PageRank score above 1.25. However, sources of accurate information very regularly have scores above 1.5. One counter example of a high PageRank source that posted misinformation is the White House Twitter account, which a fact checker found posted incorrect information. PageRank isn’t a 100% perfect algorithm, and sources with extremely high PageRank can sometimes post misinformation, but it does highlight how a single, simple algorithm could dramatically reduce the extent to which platforms amplify misinformation.Google Search provides an example of how non-engagement centric platform design responds to misinformation, and how standard information retrieval signals like PageRank can help reduce the spread of misinformation. In a 2019 study from the Stanford Internet Observatory, they ran conspiracy and misinformation related queries on Google Search, and recorded where untrustworthy and misinformation sources ranked in the results. For the 13 conspiracy related queries they ran, only one of them resulted in untrustworthy sources appearing in the top 10 results. On Google Search, misinformation performs much worse than trustworthy content, providing a contrast to how content ranking and recommendation systems work on social media platforms.Data Set Availability
If you would like access to our data set tracking all of this, please reach out to us. We are happy to share with research and civic organizations.You can see our continually updating results on our Misinformation Amplification Factor Tracking Dashboard.Appendix: Does Facebook’s Fact Checking Program Change Their Platforms Results?
Facebook is the only platform with a significant program supporting fact checking partners, and there is significant overlap between the fact checkers we use in this analysis and the fact checking partners Facebook uses in their programs. So it is worth asking if Facebook’s fact checking program creates any bias in our results.There are three ways in which Facebook’s program with fact checkers could influence our results:Facebook’s program directs fact checkers’ attention to systematically different claims than fact checkers investigate on other platformsThis could bias our MAF estimate in either direction
Facebook’s tools could allow fact checkers to be much more efficient and go beyond the most viral misinformation on the platform and uncover misinfo that does not go viralThis would cause our MAF estimate for Facebook to be underestimated relative to other platforms
Facebook’s tools systematically hide the most viral content for misinfo claims and instead surface less viral posts for all claimsThis would cause our MAF estimate for Facebook to be underestimated relative to other platforms
The third potential bias above is not possible to investigate without internal Facebook data, but we can check the first two.Does Facebook’s Program Direct Fact Checkers to Systematically Different Claims?
Facebook’s fact checking program does direct fact checkers to ignore some types of claims and investigate others. The fact checking policies instruct fact checkers to avoid evaluating celebrity gossip, sports, and opinion content, for example.To see if the misinfo posts on Facebook are on different topics, we labeled the subject matter of all the fact checks in our data set. We can then compare the topic distributions of Facebook misinfo posts and Twitter misinfo posts, since both of them have sufficient statistics for the comparison to be meaningful.
The topic distributions for Facebook and Twitter misinfo content are almost identical. The fact checkers evaluate political content most frequently, followed by health, and science.And in fact, we have enough misinformation claims on Facebook and Twitter to evaluate Facebook and Twitter strictly in situations where the fact checker identifies content across both platforms with the claim. So, we can restrict our estimation of the MAF for Facebook and Twitter to only use fact checks where both Facebook and Twitter posts containing the misinfo claim are provided by the fact checker. This means that the topic distribution is literally identical, and so any impact from Facebook’s tools guiding the fact checkers to specific claims, or only claims that went viral on one platform, are completely removed.
We find that limiting the data in this way does not have any significant impact on our results, and we see almost the exact same difference in the MAF for Facebook and Twitter.
We also see very clear separation in the distributions of MAF for Facebook and Twitter for this limited set of fact checks.Does Facebook’s Tools Improve Fact Checkers Efficiency to Go Beyond the Most Viral Misinfo?
To investigate this, we can look at the variation in misinformation amplification factors (MAFs) by fact checkers. Each fact checking organization invests different levels of resources into Facebook’s program. Organizations that invest more will be more likely to go beyond the most viral misinfo and start finding misinfo that does not go viral, because they will get deeper into Facebook’s “queue”, where presumably content is not getting as much attention on the platform.We have computed the MAF for each fact checker for Facebook, Instagram, and Twitter, to look for any dependency between the MAF and the number of Facebook posts the fact checkers assessed.


Overall, we do not see a strong relationship between the number of posts and the MAF for the platforms that would suggest this effect is significant. For Facebook specifically, we do see a slight dependence. Fact checkers that evaluate more posts do seem to have a slightly smaller MAF than those that evaluate very few posts. This effect is in the direction of Facebook’s tools helping fact checkers be more efficient.However, the magnitude of the effect we see is small. The difference in MAF between the most productive fact checkers and the least is about 4, ranging from 2.3 to 6.3. This effect is therefore negligible when compared to the differences we see between platforms, and would not change our relative assessments of the platforms.Summary
The only way in which Facebook’s fact checking program could be impacting our results in a significant way is if Facebook’s tools systematically hide the most viral misinformation posts from fact checkers, and if fact checkers heavily rely on those biased tools to surface Facebook content. This is unlikely to be the case, and so we conclude that the existence of the Facebook fact checking program does not have any significant impact on our results.