How Do Polish Adults Use and Experience Social Media?
By Matt Motyl
This is a post analyzing the University of Southern California Marshall School’s Neely Center Ethics and Technology Indices. The project builds on industry precedent to create independent verifiable, cross-platform metrics of user experiences, which we leverage in discussions with companies, the press, and policy makers. You can read more about the methodology of the project here and find a full list of analyses here.
Over the past 16 months, the Neely Social Media Index has focused squarely on US adults. Yet, the US is not representative of all adults around the globe, and has relatively limited regulations on social media. Therefore, we are excited to unveil our first international results, which thanks to a partnership with some of our colleagues at SPWS University, come from Poland.
As one of the 27 European Union member states, social media companies operating in Poland must comply with the expansive Digital Services Act, which requires data transparency, regular risk assessments, and prohibits a wide range of harmful content including disinformation, harassment of women and/or minors, hate speech, and even targeted advertising. If the European Commission decides that a platform is not taking sufficient action to protect users from the listed harms, they are permitted to fine the company that owns the violating platform 6% of their total global revenue. In other words, companies operating in the EU should be even more motivated to protect users from harmful content. It is too early to tell how effective the DSA will be, but it could lead to better experiences for social media users living in the EU.
Given that the law is new, not all of its features have been rolled out so far. Perhaps most relevant for us is the data transparency requirements that would allow researchers to examine the specific content users encounter on these platforms to determine the prevalence of different negative (and positive) experiences. Currently, some aggregated summary data from some platforms are available, but none sufficiently granular to really capture individual users’ experiences. In the meantime, we can assess a baseline of experiences using the Neely Social Media Index survey.
Method
In order to provide local context, both in terms of content and methodology, our work was done in collaboration with a leading Polish University. Colleagues at SPWS University translated the questions used in the English- and Spanish-language surveys we administer to our sample of US adults. The structure of the survey remained the same. We ask respondents about what social communication and media platforms they use followed by questions about the experiences they have on the platforms that they use. To obtain a sample of Polish adults, we worked with Ariadna, the largest nationwide research panel in Poland with more than 300,000 registered panelists, recruited randomly from various online destinations (more here). Of those, a sample of 3,193 Polish adults completed our Neely Social Media Index survey in the Spring of 2024. Our sample was quota sampled to resemble Poland’s national population make-up in terms of gender (51% women) and age (median age of 18+ adults is 47).
What Services Are Used?
The most widely used online service among Polish adults is Facebook (81%), followed by YouTube (69%), Email (66%) and Text Messaging (60%). Less than 1% of Poles used Nextdoor and Mastodon. Very few Poles use Facetime (2%), which makes sense in light of the fact that Android phones are ~5x more popular in Poland than iPhones, meaning that very few people have that messaging service readily available to them on their device. We also see that roughly half of Poles use WhatsApp (47%), which is consistent with other polls, lending further confidence in the representativeness of the sample.

How often are these services used?
The most frequently used service is Facebook, which 86% of users open at least once per day. Email is the second most frequently used service with 78% of Polish adults checking it at least once per day. In other words, people check their Facebooks more often than they check their Email boxes.
We also see similar usage patterns on WhatsApp and Text Messaging. This similarity further reflects international norms of using the more cost effective internet-based communication service (WhatsApp) over the cellular-based service (Text Messaging) when chatting with people outside the borders of one’s own country. LinkedIn, Pinterest, and YouTube are all used less frequently, but this may simply reflect the different use cases of those platforms. Specifically, people may not use LinkedIn all that often, unless they’re looking for a job. Pinterest and YouTube both tend to cater towards hobbies and learning how to do things, which may not be sufficient justifications to log on multiple times per day, as is the case with some of the more traditional social media platforms. Our results roughly mirror what other examinations of Polish social media use have found, suggesting that our sample is reasonably representative of Polish users.

What services deliver the most (and fewest) negative experiences?
We asked respondents whether they had personally witnessed or experienced something that affected them negatively in the past 4 weeks on each of the platforms that reported using. The majority of people do not report personally witnessing or experiencing something that affected them negatively. However, there is substantial variability between platforms in the rates at which their users report these personal negative experiences. 19.5%, or nearly 1 in 5, of X (Twitter) users reported a recent personal negative experience. Facebook (17.3%), TikTok (15.5%), and Dating Apps (14.6%) rounded out the top cluster of services with the highest rates of negative experiences. On the other end of the distribution, we see that Pinterest (0.66%), LinkedIn (1.83%), and WhatsApp (2.3%) have the lowest rates of negative experiences.

Given the wide range of purposes these services were built for and reasons why people use these different services, the negative experiences may differ across services. To allow us to examine this, we asked all panelists who reported using a service and having each negative experience, 2 follow-up questions. The first follow-up question was:
Did your experience on [insert service here] relate to any of these topics?
Politics
Medical/health information
Crime
Local news
Personal finance
None of the above
In the heatmap below, we see considerable variability in the topics people identified as characterizing the content related to their negative experience. While the most commonly selected topic in the sample was Politics, this was not the most commonly selected topic for all platforms. Our survey was conducted during a period of Polish elections, suggesting that Politics was likely a key area of discussion. On X (Twitter), nearly 2 out of 3 users reporting a negative experience stated that it was related to politics, and more than 1 out of 3 stated that it was related to crime. X (Twitter) is the only service where the majority of users reporting a negative experience stated it was related to politics. The other, more traditional social media platforms had greater balance across topics. For example, 46% of Facebook users reporting a negative experience described it as relating to politics, but around a quarter of users also described their experiences as related to crime and/or local news. In contrast, people reporting negative experiences with text messaging and email were much more likely to state that it was related to crime, personal finance, and/or some other topic. Notably, a third of participants reporting a negative experience across platforms said the experience didn’t pertain to any of the listed topics.

In addition to getting a sense of the topic of the negative experience, we asked an additional follow-up question to understand what impacts respondents thought that experience would have on them:
What was the impact of your negative experience with [insert service here]?
It made me less likely to express myself online
It negatively impacted my psychological well-being
It reduced my trust in other people
It reduced my trust in social institutions
It made me angry
It worried me
I felt unsafe
I felt attacked
It did not affect me a great deal
It annoyed me
Other
In the heatmap below, we see the most frequently selected impact of these negative experiences was annoyance, followed by anger. In fact, the majority of people reporting a negative experience when using email said that that experience annoyed them (54.4%). Email users having negative experiences were also more likely than users of other services to say that the experience did not have a great effect on them (10.1%). On the other end of the spectrum were Facebook users reporting a negative experience, with just 4% saying that it did not have a great effect on them; these Facebook users were most likely to report impacts of feeling angry (41.5%), annoyed (40.2%), and having reduced trust in other people (35.5%). X (Twitter) users having negative experiences reported similar impacts as Facebook users, but were more likely to also say that the experience made them feel unsafe (25.3%) and feel less trust in social institutions (24.1%).

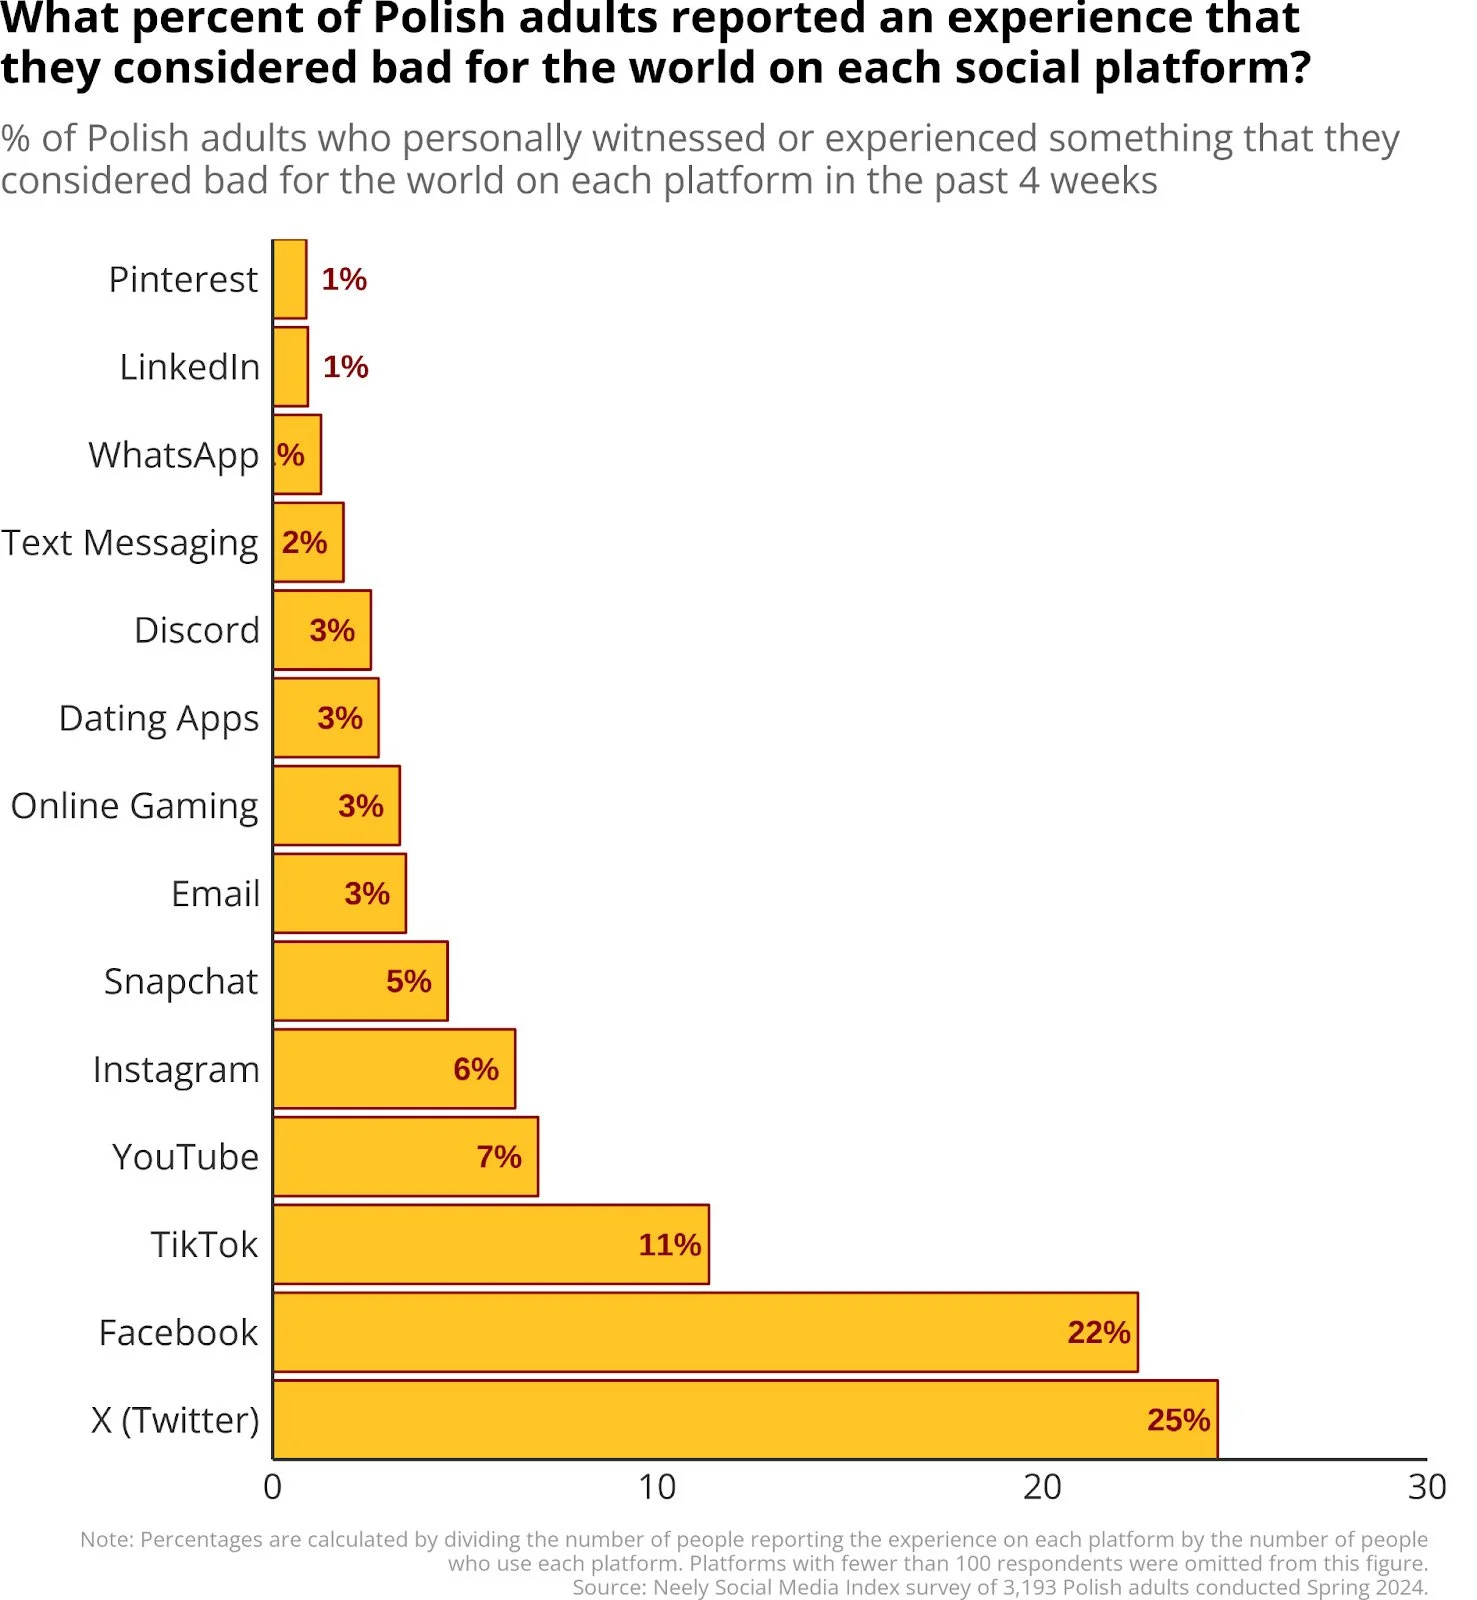
The other negative experience in the Neely Social Media Index survey pertains to those that people believe are negative for society. Again, the majority of Polish adults do not report recent experiences on these social platforms that they believe are bad for the world. Once again, X and Facebook stand above the rest, with 25% and 22% of their users, respectively, reporting experiences that are bad for the world. On the other end of the distribution, Pinterest, LinkedIn, and WhatsApp users report the lowest rates of recent experiences with content they believe is bad for the world.
Again, for panelists who reported one of these experiences we asked them the same two follow-up questions about the topic and impact of the experience. For users reporting experiences that they thought were bad for the world, politics was identified as the topic describing that experience for the majority of these users on X (77.3%), Facebook (71.6%), YouTube (68%), and TikTok (50.1%). Crime was the second most commonly identified topic, with about 1 in 3 social platform users selecting it to describe the experience that they had that they thought was bad for the world.

For the question about the impact of these experiences believed to be bad for the world, we provided the following response options which differ from the personal negative experience question described earlier:
It could increase political polarization
It could increase hate, fear, and/or anger between groups of people
It could increase the risk of violence
It could misinform or mislead people
It would not have much of an effect
Other
In the heatmap below, we see that that majority of X and Facebook users who have experiences they perceive to be bad for the world believe that the experience could increase hate, fear, and/or anger between groups of people (64.5% & 64.4%, respectively), increase political polarization (60.9% & 51.4%, respectively), and misinform or mislead people (59.1% & 58.4%, respectively). For all of the widely used platforms with at least 30 respondents saying they had an experience they perceived as bad for the world, except for Text Messaging and Email, 43.8 to 46.9% said that the negative experiences on these platforms could increase the risk of violence in society.

Across both the personally and socially negative experience lines of questions, we see that X and Facebook show the highest rates of these bad experiences, which are most commonly related to politics and crime. Users reporting negative experiences describe feeling annoyed, angered, and less trusting of other people, while also fearing that these experiences could fuel greater anger, polarization, violence, and could misinform people.
What services deliver the most (and fewest) positive experiences?
Of course, people also have positive experiences while using these online services. The Neely Social Media Index includes two questions to capture two types of these positive experiences: social connection and learning.
First, we asked people whether they had experienced a meaningful connection with others on the services that they reported using. The large majority of Polish adults did not report experiencing a meaningful connection across any of the services we asked about that they used, provoking an interesting question about whether these services are really doing what they’ve ostensibly been designed to do (i.e., to connect people to each other). When looking at the rank ordering of these services, we see that people using online dating services were most likely to report experiencing a meaningful connection with others in the past 4 weeks. Discord (15%), Facebook (14%), WhatsApp (13%), and Snapchat (11%) round out the top cluster of services with users reporting relatively higher rates of recent meaningful connections. On the other end of the distribution are Pinterest and YouTube, which are two platforms that are designed more to connect people with content than with other people.

Secondly, we sought to determine whether users had gained meaningful knowledge or insights from the online platforms they frequented. We asked if they had learned something useful or had their understanding of something important enhanced through these services. Again, the large majority of Polish adults did not report learning something useful or feeling that these services helped them understand something important. YouTube led all services with 24% of its Polish adult users reporting learning something useful or important in the past 4 weeks. On the other end of the distribution, Text Messaging (2%), Online Gaming (3%), and WhatsApp (3%) users reported the lowest rates of learning experiences of all platforms included in our survey.

In Summary
This is the first international installment of the Neely Social Media Index, and sheds light into social media users in one of the 27 EU member states under the protections of the new Digital Services Act. Despite being fully enacted in February of 2024, questions remain regarding how this regulatory regime will monitor risks and harms to users. While the DSA calls for independent audits of harms, the details of these audits remain vague. As social scientists with experience in measurement of social media experiences, we would like to propose one useful source of tracking harms to users is through user surveys, which may shed light onto harms that are not yet captured adequately by artificial intelligence and machine learning-based classifiers.
In this first survey of European social media and communication service users, we found that X (Twitter), Facebook, and TikTok users reported the highest rates of negative experiences. Perhaps not surprisingly, the companies owning these 3 services (X, Meta, & Bytedance) are also some of the first to have formal DSA proceedings opened looking into their potential failures in protecting their users from harmful experiences.
Some of the results in this sample of Polish adults are similar to those that we have found in our sample of US adults. For example, the rank ordering of platforms in terms of their negative experiences and learning experiences is similar. In both samples, X, Facebook, and TikTok tend to have the highest rates of negative experiences, and Pinterest and LinkedIn tend to have the lowest rates of negative experiences. In both samples, YouTube leads the way in terms of users reporting learning something important. The point estimates, though, differ considerably. For example, less than 1 in 4 Polish adults report learning something important on YouTube, but that number jumps to more than 1 in 2 US adults. These differences could be due to a number of factors including cultural differences in how people use these services, how users interpret these questions, or language translation discrepancies, among other things. In a subsequent report, I will conduct a more formal cross-national comparison between our Polish and American samples.
1 The margins of error differ across platforms as a function of the number of users of each platform. For the largest platforms, the margin of error is ~1.8%. By contrast, the smaller platforms’ margin of error is as high as 11%.
• • •
This post originally appeared in “Designing Tomorrow” on Substack.
Questions? You can reach our team at hello@integrityinstitute.org.